


Keeping your facility running smoothly is no easy feat, especially when it comes to cooling towers....
Why Most Facilities Underestimate Their Financial Exposure
Cooling towers are often treated as background equipment.
They operate quietly. They rarely demand attention. And when they appear to be running, they are assumed to be fine.
But in manufacturing plants, data centers, healthcare campuses, and large commercial facilities, cooling towers are not peripheral systems. They arecentral to thermal stability and operational continuity.
When a cooling tower fails or drifts outside of optimal performance, the financial consequences can escalate rapidly.
Most facilities never quantify that exposure.
This article breaks down the real cost of cooling tower downtime and explains why cooling infrastructure should be viewed as a financial risk asset, not simply a maintenance line item.
Direct Costs of a Cooling Tower Failure
When a cooling tower fails unexpectedly, emergency expenses accumulate immediately.
Typical direct costs include:
Capital and Emergency Response
- New cooling tower: $50,000 to $200,000 or more
- Emergency crane and installation: $30,000 to $150,000
- Rental cooling tower: $15,950 or more per month
- Temporary pumps, piping, and electrical: $20,000 to $100,000
- Water treatment and remediation: $5,000 to $75,000
Estimated direct exposure per event:
$150,000 to $500,000
These numbers reflect only immediate response costs. They do not include lost production, overtime labor, equipment stress, or contractual penalties.
The True Exposure: Downtime Per Hour
The largest financial risk is not the equipment replacement.
It is an operational interruption.
In many industrial environments, downtime can exceed $260,000 per hour. In high-throughput facilities, that number can be significantly higher depending on:
- Hourly production throughput
- Number of interdependent lines
- Restart and sanitation requirements
- Compliance and regulatory constraints
- Service level agreements
Example Scenario
12-hour outage × $260,000 per hour
Total exposure: $3,120,000
In complex facilities, a single cooling tower failure can produce total financial exposure between $3 million and $20 million or more.
Cooling towers often support:
- Injection molding and extrusion systems
- Paper and board machines
- Chiller condenser loops
- Hydraulic systems
- Compressors
- Data center heat rejection systems
When condenser water temperatures rise, cascading instability can occur quickly. Chillers may lock out. Production scrap increases. Equipment experiences thermal stress. Restart timelines extend.
In many facilities, the cooling tower represents a single point of failure capable of disrupting operations within minutes.
The Hidden Cost Before Failure: Energy Penalties
Not all losses are catastrophic events.
Many are silent and ongoing.
Cooling towers frequently degrade thermally before structural or mechanical failure occurs. Scaling, fouling, airflow restriction, and fill deterioration reduce heat transfer efficiency.
Every 1 degree Fahrenheit increase in condenser temperature can increase chiller energy consumption by 1 to 2 percent.
Many facilities unknowingly operate 5 to 15 degrees above optimal design conditions.
Estimated annual energy penalty per tower:
$50,000 to $200,000
A cooling tower can appear operational while quietly increasing annual operating costs by six figures.
Most Facilities Have Never Modeled This
Consider the following questions:
- Do you know your true hourly production exposure?
- Do you know what a 6-hour outage would cost?
- Do you know how much thermal inefficiency is adding to your annual energy spend?
- Do you know the financial difference between reactive repair and structured maintenance?
Most facilities cannot answer these questions with precision.
Cooling infrastructure risk often exists without being measured.
Preventative Maintenance vs Financial Risk
When viewed strictly as maintenance, cooling tower service may appear as an expense.
When viewed financially, it becomes risk mitigation.
Typical structured preventative maintenance program:
$10,000 to $20,000 per year
Typical inspection and cleaning event:
$5,000 to $15,000
Potential failure exposure:
$3 million to $20 million or more
Preventing even one hour of downtime can outweigh an entire year of preventative maintenance.
The conversation shifts from cost control to exposure control.
Why Downtime Costs Vary by Facility
No two facilities experience identical cooling tower risk.
Financial exposure depends on:
- Production throughput per hour
- Redundancy design
- Number of dependent systems
- Seasonal demand cycles
- Rental equipment availability
- Compliance requirements
A data center calculates exposure differently than a plastics plant. A hospital differs from a food production facility.
But in every environment, cooling performance stability directly correlates to operational continuity.
A Practical Framework for Estimating Risk
Facilities can begin modeling exposure using a simple formula:
Hourly Production Value × Estimated Outage Duration = Downtime Exposure
Example:
$180,000 per hour × 8-hour outage = $1,440,000
This does not include emergency capital costs, energy penalties, equipment damage, or long-term operational impact.
When these variables are combined, cooling infrastructure becomes a strategic operational asset rather than a background utility.
Calculate Your Cooling Tower Downtime Risk
Cooling tower instability should not be treated as a maintenance inconvenience.
It is a financial risk variable.
Most facilities operate without knowing their actual exposure number. Without that clarity, it becomes difficult to justify preventative maintenance programs, mechanical upgrades, or redundancy planning.
Our Cooling Tower Downtime Risk Calculator allows you to model your facility-specific exposure in minutes.
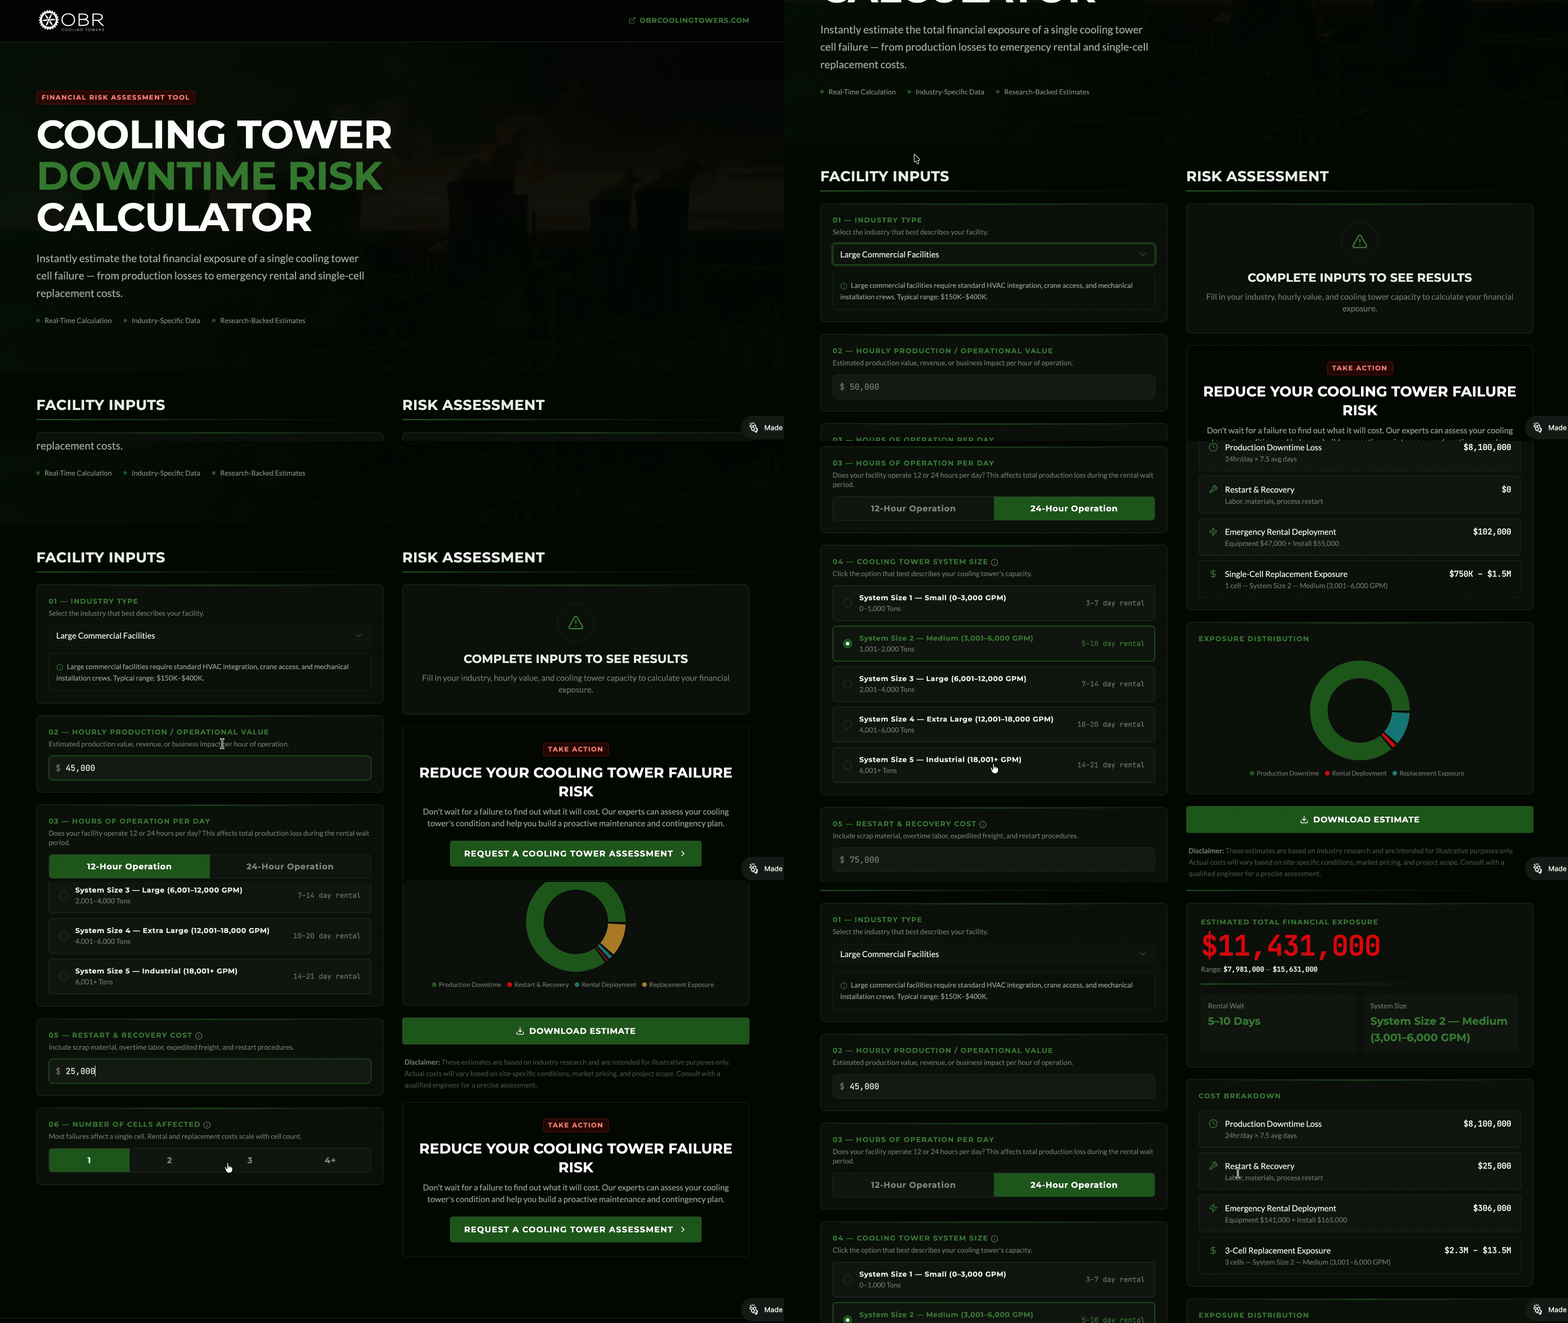
In less than five minutes, you can input:
- Hourly production value
- Estimated outage duration
- Number of dependent systems
- Energy penalty assumptions
- Restart and compliance costs
The calculator generates:
- Estimated financial exposure per outage
- Annualized risk modeling
- Energy loss projections
- Preventative maintenance ROI comparison
This is not an industry average.
It is your number.
Access the Cooling Tower Downtime Risk Calculator instantly and quantify your facility’s exposure today.
Conclusion: From Reactive Events to Measurable Risk
Cooling tower failures are rarely isolated mechanical incidents.
They are financial events.
Facilities that treat cooling towers as engineered risk assets rather than background equipment gain control over:
- Operational continuity
- Energy efficiency
- Capital planning
- Regulatory compliance
- Long-term equipment reliability
The difference between reactive emergency response and engineered operational stability begins with visibility into risk.
If cooling performance affects your operation, understanding that number is not optional.
It is strategic.